

PINGSENG and PMOD (Switzerland) reached a strategic partnership on the global market in 2017.
Molecular imaging methods are rapidly evolving. Hybrid systems allow correlating function and morphology with unprecedented accuracy and resolution. The PMOD software has been designed for researchers in this challenging field. It provides solutions for all stages of quantitative data processing, helping the researchers focus on contents rather than tool programming.
|
The most reliable choice in the field of quantitative analysis: ·Validated by the world's leading research institutes ·Professional biomedical image quantitative analysis system ·Provides a comprehensive solution to molecular imaging and data processing |
Extensive application of authority: ·Used by more than 500 units worldwide ·Cited by more than 1,000 internationally renowned journals ·An ideal scientific research tools unanimously recognized by a number of medical research institutes, medical universities, pharmaceutical companies, hospitals and medical equipment companies |
Powerful and comprehensive functions of PMOD software:
▪ Research and analysis of drug metabolism
In the whole process of drug absorption, retention and metabolism, the correlation between different tissues and organs is quantified by parameters K1 and K2 and displayed in different colors.
▪ 3D stereoscopic display of 2D image information
After registration and fusion of a large number of 2D image information, it is displayed in 3D stereoscopic image, which reduce the reading image for researchers and doctor and improve the accuracy.
▪ Fully satisfy all the functions of medical image analysis
Image Processing, Regions of Interest, Fusion and Registration, Image Segmentation.
▪ Whole body tissue and organ models
Image processing and data analysis are automatically compared with their models, including the models of the heart, brain and viscera.
▪ Images of human and small animals
The data of rats, mice and human bodies were automatically contrasted and modeled.
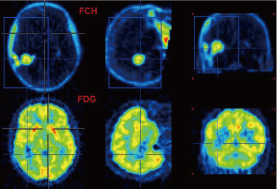
▪ Assessment of Alzheimer's disease and indication of the location of the disease
A unique algorithm was used to evaluate the patient's probability and to mark the location of the disease in a special color.
.png)
Scatter plots are a convenient method for exploring tissue function, if matched image series are available.
For instance, with the brain PET example illustrated above, the following scatter plot of the pixel values in the blue VOI box is obtained.

 中文
中文

.png)
.png)